Divvy
Price to Rent Ratio Calculator for Smarter Decisions
By The Divvy Team · October 20, 2026 · 18 min read
You've probably heard a tidy rule like this: if the ratio is low, buy, and if it's high, rent. That advice is popular because it's fast, and it's misleading for the same reason. A price to rent ratio calculator can tell you how a purchase price compares with a year of rent, but it can't tell you whether you can afford the mortgage, handle repairs, or stay long enough for buying to pay off. Treat it as a first screen, not a verdict, and it becomes useful.
Table of Contents
- Why Price to Rent Matters
- The Price to Rent Ratio Formula
- Choosing Comparable Inputs
- Build Your Calculator Inputs
- Worked Price to Rent Examples
- Interpret the Ratio Responsibly
- Use the Ratio in Buy Versus Rent Decisions
- Make a More Complete Housing Decision
Why Price to Rent Matters
You're touring a home you'd happily live in, and a similar place nearby rents for a monthly amount that feels manageable. The sale price, though, is a much larger number that is harder to judge on its own. Dividing that price by a year of comparable rent gives you a common scale, so you can ask a focused question: how expensive is ownership relative to renting a similar home in this area?
That question matters because price alone hides context. Two homes can carry the same price tag while local rents differ sharply, which means the same purchase can look modest in one market and stretched in another. A low ratio generally signals prices are modest compared with rents, while a high ratio signals prices are expensive relative to rental income, a basic distinction covered in standard price-to-rent definitions.
What the Number Can and Can't Do
Used well, the ratio helps you sort homes and neighborhoods into a short list worth deeper analysis. It can flag a listing that deserves a closer look, or one where renting a comparable home may deserve more patience. What it can't do is measure your monthly cash flow, mortgage risk, or expected return.
- Affordability is separate: A favorable ratio doesn't guarantee the loan payment, taxes, and insurance fit your income.
- Risk is separate: Job stability, emergency savings, and your likely time in the home change the answer.
- Profit is separate: For investors, gross rent ignores vacancy and operating costs, so it isn't a return calculation.
A useful ratio starts a better conversation. It should never end one.
Once you have the number, the real work turns local. A ratio only earns its meaning when you weigh it against what similar homes actually rent for nearby, what financing would cost at current terms, and how many years you expect to stay in the home.
The Price to Rent Ratio Formula
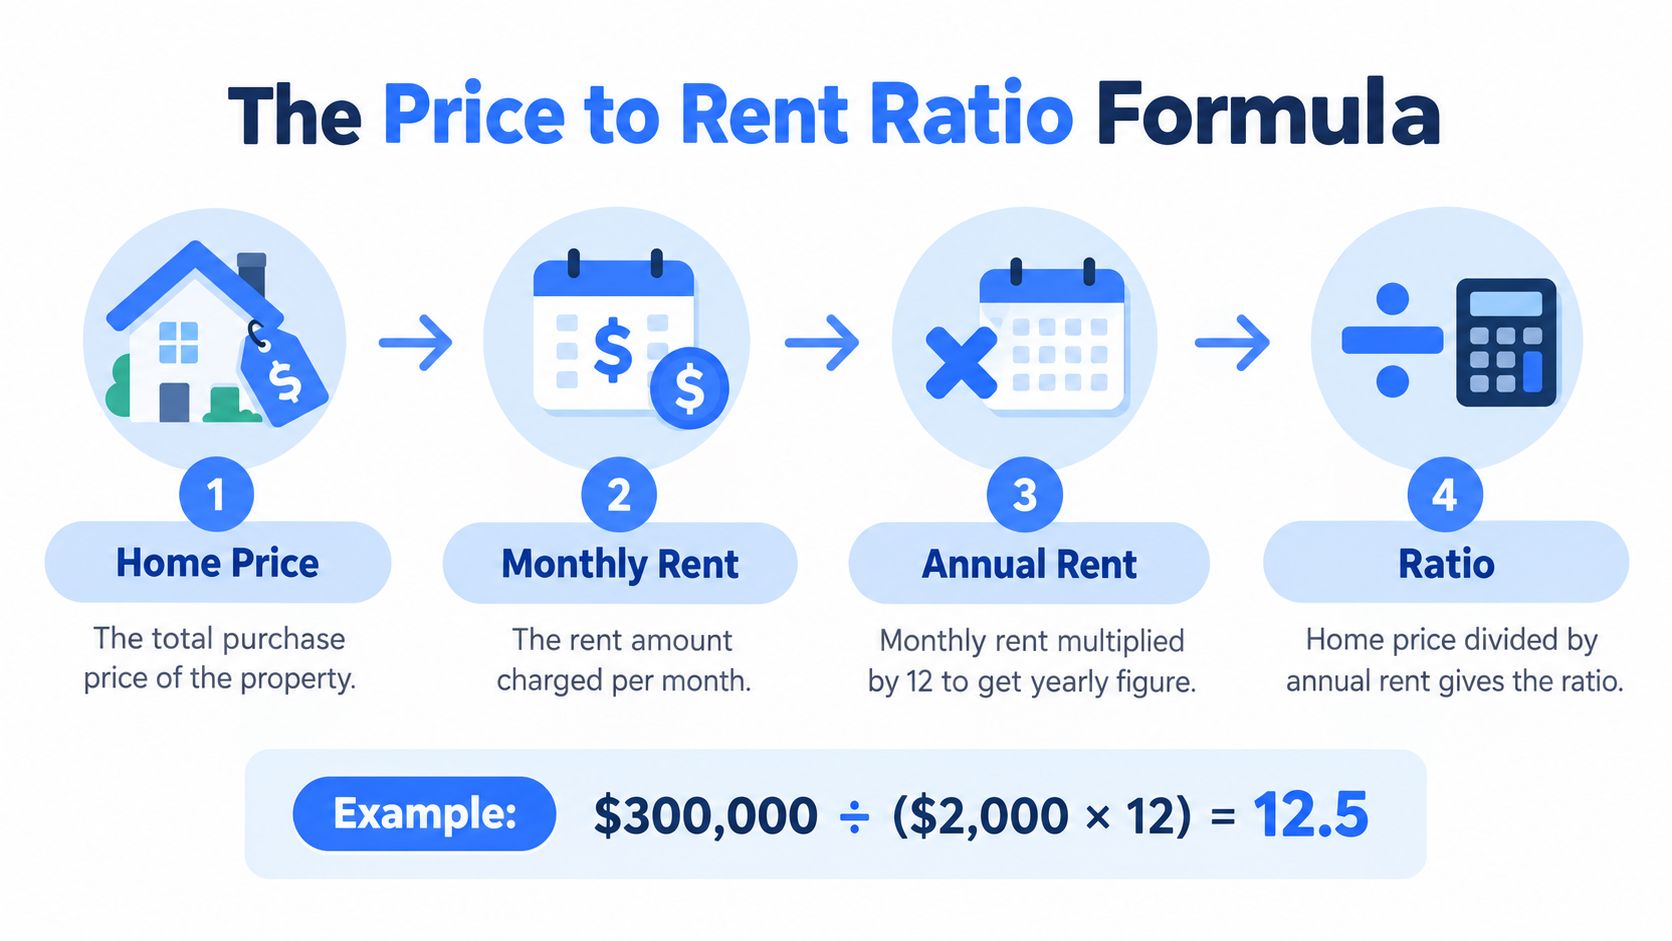
Start with two numbers for the same kind of home: the purchase price and the rent it could command. Most listings quote rent monthly, while the formula needs a full year, so the first step is a conversion. Multiply monthly rent by twelve to get annual rent, then divide the price by that annual figure.
Building It Step by Step
- Find the home price: Use the full purchase price you're evaluating, not the loan amount.
- Find monthly rent: Use rent for a comparable home, not just any rental nearby.
- Convert to annual rent: Multiply the monthly figure by twelve.
- Divide: Price divided by annual rent gives you the ratio.
Here's the standard example: a $300,000 home renting for $2,000 a month produces $24,000 in annual rent and a ratio of 12.5, following the formula median home price ÷ median annual rent described in the definition linked earlier.
Reading the Result in Plain Language
The ratio has no units, but you can read it as years of gross rent needed to equal the price. A result of 12.5 means the price equals twelve and a half years of rent before taxes, maintenance, insurance, financing, and vacancies enter the picture. That's why it's a screening tool rather than a complete model.
You'll also see the relationship flipped. The rent to price ratio is the reciprocal, often expressed as an implied gross rental yield, so that same 12.5 corresponds to an 8% gross rent to price rate before expenses, as noted earlier. If terms like yield, cap rate, or gross rent multiplier start to blur together, a real estate investing terms glossary can help you keep each label attached to the right formula before you compare tools.
Remember the denominator: Monthly rent must become annual rent first. Skipping that step is the most common beginner error.
A price to rent ratio calculator automates those steps. Your job is to make sure the two inputs describe the same kind of housing, because the math will happily produce a precise answer from mismatched numbers.
Choosing Comparable Inputs
A calculator can't detect a bad comparison. If you pair a single family home's sale price with rent for a small apartment across town, you'll get a number that looks authoritative and means very little. The price and rent inputs need to match on geography, property type, and time period, since mixing a city's median sale price with a national rent measure can produce a misleading result under the conventions in the Investopedia source linked earlier.
Rent definitions deserve the same scrutiny. Asking rent, rent paid by recent movers, and a median across many homes are different measures, and they answer slightly different questions. For reference, HUD Fair Market Rents and what they include are discussed in Federal Reserve Bank of St. Louis material that notes such standardized estimates sit near the 40th percentile of rents paid by recent movers for standard quality housing and include utilities except telephone, which means they aren't interchangeable with a landlord's asking rent that excludes utilities.
Matching Decisions to Make
| Choice | Safer approach | Risk to avoid |
|---|---|---|
| Geography | Same neighborhood or city for both inputs | Local price paired with national rent |
| Property type | Similar size, layout, and condition | House price paired with apartment rent |
| Timing | Price and rent from the same period | Current price paired with an old lease |
| Rent definition | Note asking, paid, median, or standardized rent | Assuming every rent figure means the same thing |
Space matters too, and how to calculate rent per square foot can help you sanity check whether a rental comparable is really similar in size before you trust its monthly figure. For investment screening, PropLab rental deal screening offers a related way to think about price against gross rent, which is useful once you've confirmed your comparables are genuinely alike.
Property Ratio or Index Ratio
One more distinction trips people up. A property level ratio divides an actual price by actual annual rent, so the result reads as years of rent. An index based version divides a house price index by a rent index after both are rebased to the same date, as described in the St. Louis Fed material linked above, and that version tracks relative pressure over time rather than a literal multiple for one home. Don't compare the two as if they were the same measurement.
Write down where each input came from and what it represents. That short note will save you from overtrusting a result later.
Build Your Calculator Inputs
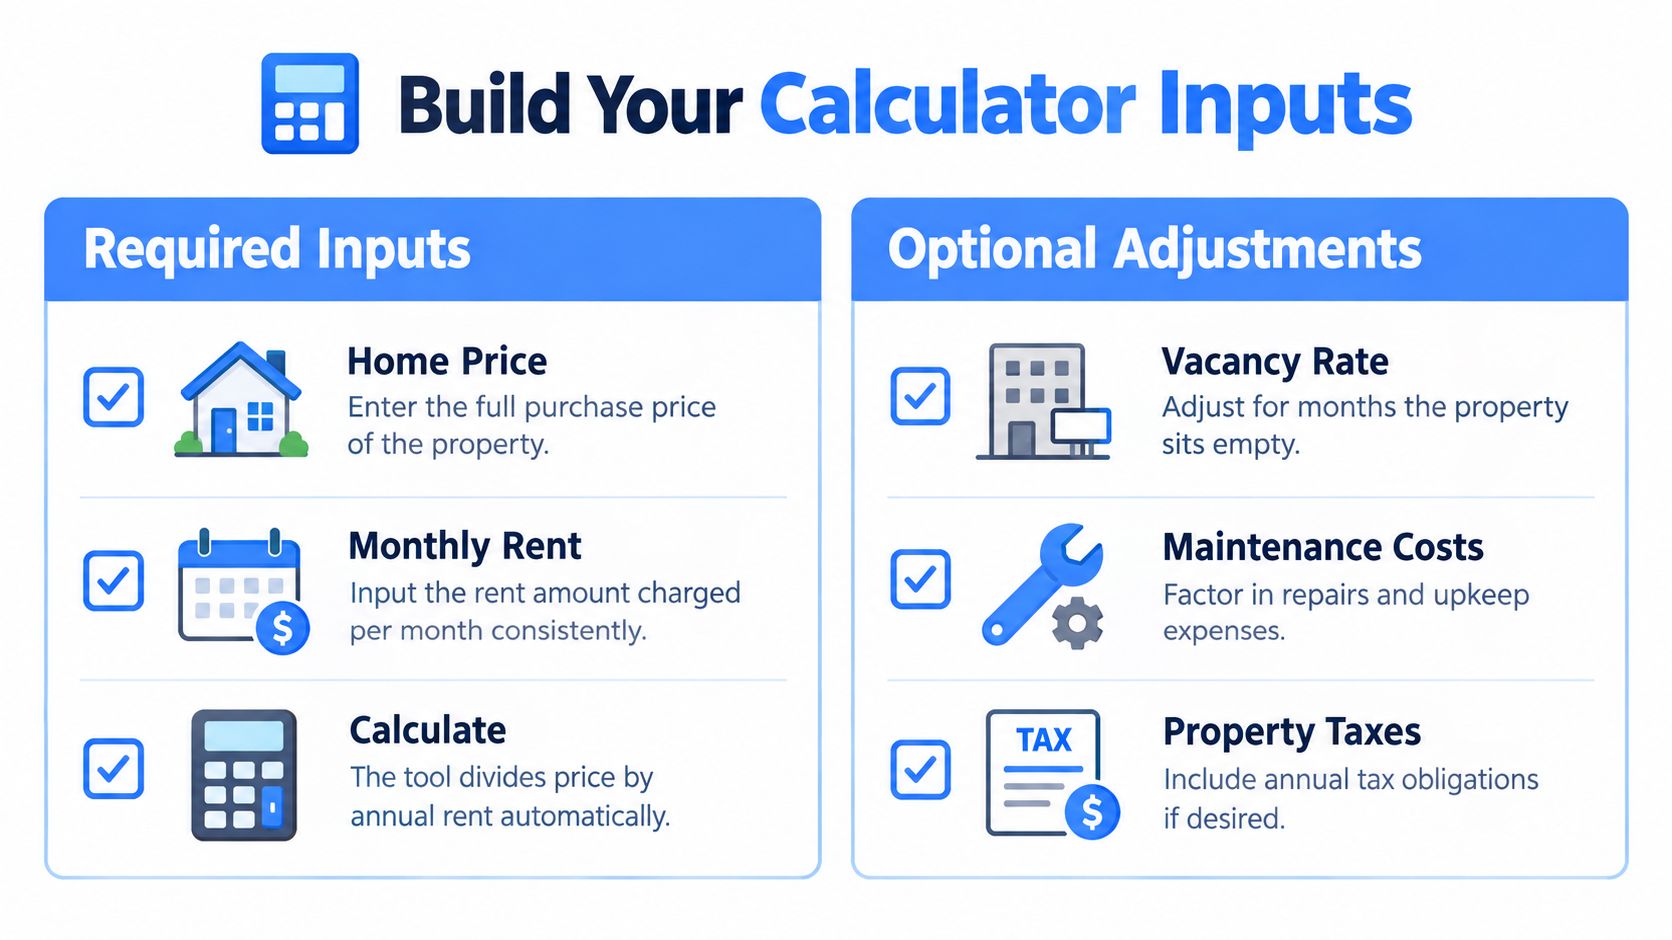
Open a price to rent ratio calculator and you'll usually see two required fields, then a set of optional adjustments. Keep those layers separate in your mind. The required fields produce the gross ratio, a clean screening number, while the adjustments help you build a more realistic net view that reflects the costs of owning or operating the home.
Required Inputs First
Enter the full home price you're considering, then enter monthly rent for a comparable home using a consistent definition each time you run the tool. If you switch between asking rent for one property and a conservative stabilized rent for another, your comparisons won't be like for like. Run the gross calculation first and record it before you change anything, because that baseline is what you'll compare against local alternatives.
Optional Adjustments That Change the Story
- Vacancy: Reduces the rent you collect when a unit sits empty between tenants.
- Property tax and insurance: Recurring ownership costs that gross rent completely ignores.
- Maintenance and capital repairs: Routine upkeep plus larger items that arrive irregularly.
- HOA or condo fees: Monthly charges that can rival other operating costs in some communities.
- Management costs: Relevant for investors who pay someone else to handle tenants and repairs.
As the breakdown at a price to rent ratio calculator that separates gross and adjusted inputs notes, gross annual rent ignores vacancy, property tax, insurance, HOA or condo fees, maintenance, capital repairs, and management costs, and even adjustable tools depend on user supplied estimates, with maintenance set as a fixed percentage potentially far from actual repairs in a given year.
Keep assumptions visible: Write every adjustment next to your result. A ratio without its assumptions is hard to revisit or challenge.
Treat each adjusted run as a scenario, not a promise. Change one assumption at a time, such as vacancy or insurance, and watch how the net picture moves. That habit turns the calculator from a one answer machine into a learning tool, and it prepares you to judge whether a property still looks reasonable when conditions are less friendly than today's listing suggests.
Worked Price to Rent Examples
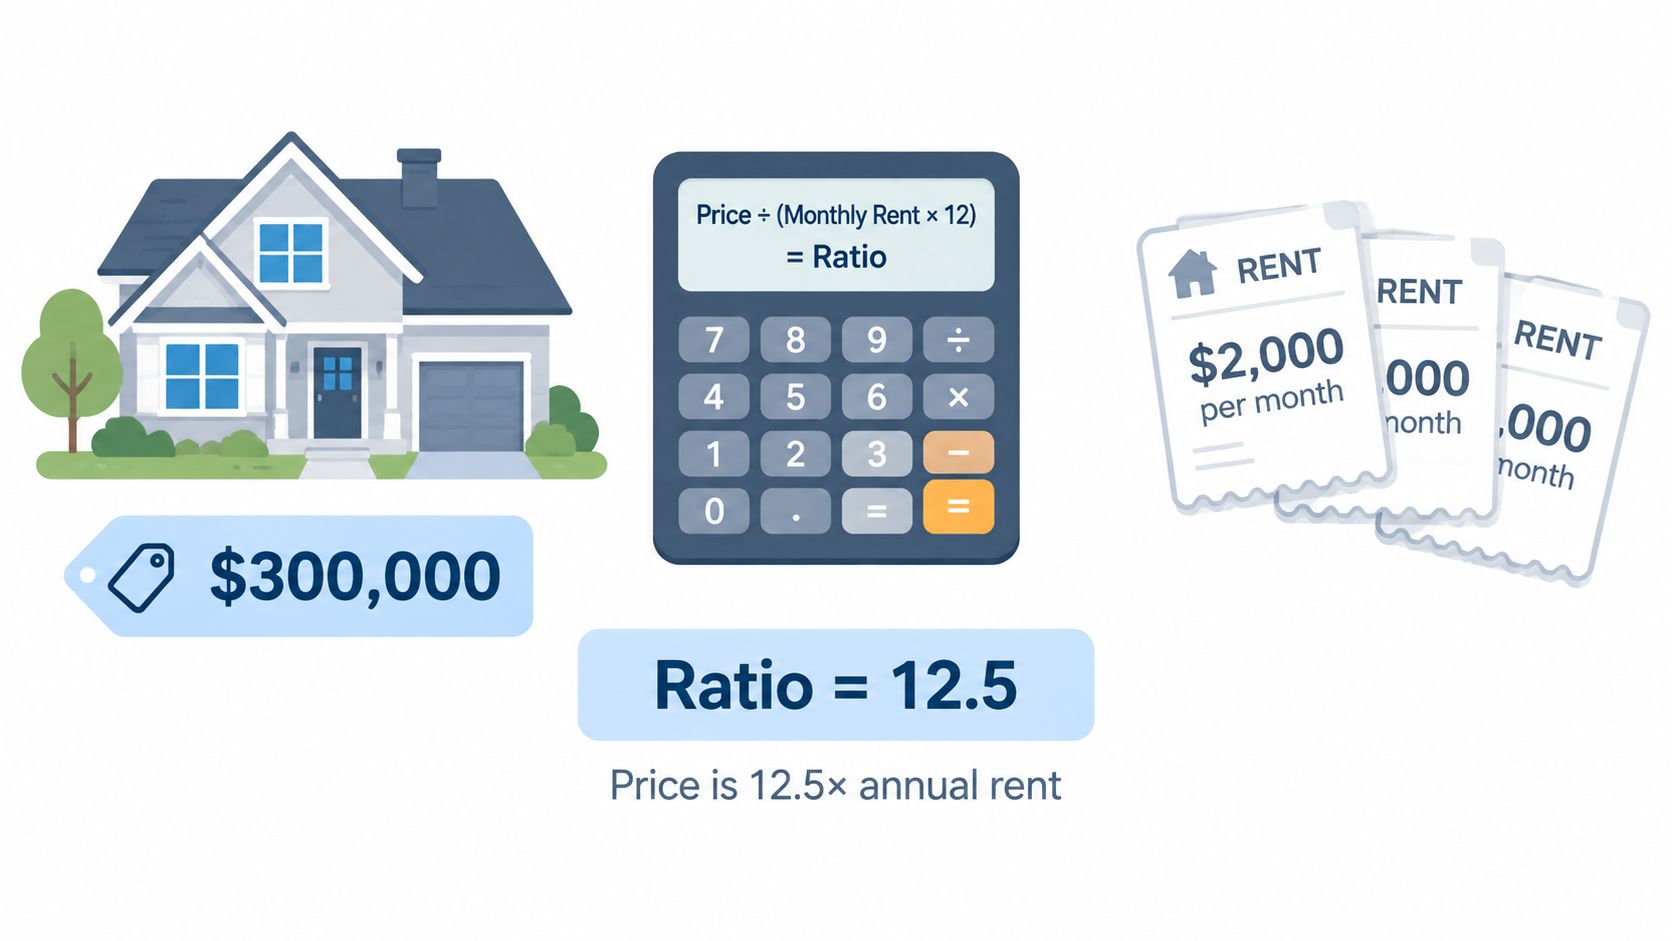
Examples make the arithmetic stick, so start with the home from the formula discussion: price of $300,000, monthly rent of $2,000, annual rent of $24,000, and a ratio of 12.5 using the method in the Investopedia source linked earlier. Read that as twelve and a half years of gross rent equaling the price, with no expenses counted yet. The visual below restates that relationship so you can see the pieces side by side.
Changing One Input at a Time
Now hold rent steady and imagine the asking price rises while the home itself stays the same. The numerator grows, annual rent doesn't, so the ratio climbs and the home looks more expensive relative to renting it. Nothing about the property improved, yet the screening signal worsened, which is exactly what the ratio is designed to reveal.
Reverse the experiment and hold price steady while comparable rents rise. Annual rent grows, the denominator gets larger, and the ratio falls. For a prospective owner occupier, that can make buying look more reasonable relative to renting. For a renter, the same rent increase is a real cost, which shows why the ratio describes a relationship rather than declaring a winner for every household.
Gross Rent Versus Usable Income
Next, add reality back in. Suppose that same rental sits vacant for part of the year and needs repairs, so collected rent falls short of the full annual figure and operating costs claim another share. The gross calculation still says 12.5, because it never counted those items, but the income available to cover ownership costs is clearly smaller. That gap is why investors move from the gross ratio toward a net operating view, and why owner occupiers should compare rent with full monthly ownership cost instead of price alone.
The short video below walks through the same mechanics at a slower pace, which can help if the reciprocal relationship still feels abstract.
A Reusable Sequence
- Calculate the gross ratio with matched price and rent inputs.
- Vary one input and note how sensitive the result is.
- Layer in vacancy and expenses to see the net picture.
- Ask what would change your mind, such as a different mortgage rate or a shorter stay.
Notice what this sequence doesn't do. It doesn't stamp 12.5 as good or bad in isolation, because that judgment depends on local norms, financing, and your time horizon.
Interpret the Ratio Responsibly
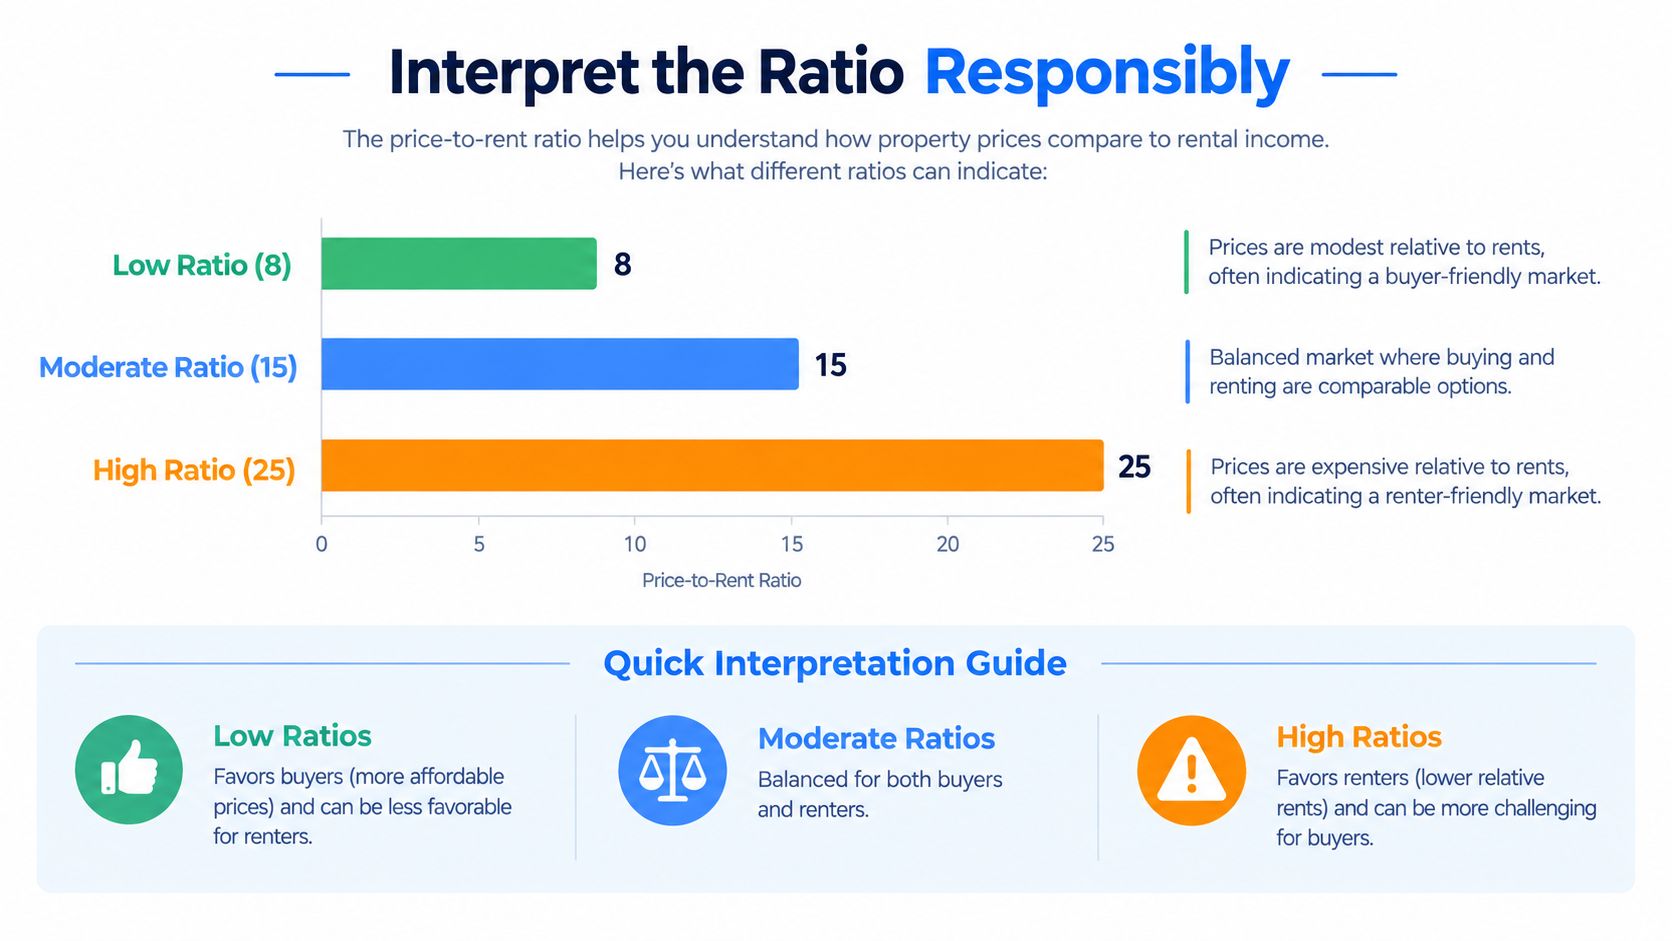
The basic intuition is sound: lower results suggest prices are modest relative to rents, and higher results suggest prices are expensive relative to rental income. Trouble starts when people turn that intuition into a universal cutoff that supposedly works in every city and every interest rate environment. History shows why that shortcut fails.
Benchmarks Move Over Time
Long run research summarized in a Federal Reserve study of rent to price behavior from 1975 to 2005 found the rent to price ratio broadly flat nationally and across all four Census regions until about 1995, then declining over the final decade, which means the price to rent ratio rose as homes grew more expensive relative to rents; related Federal Reserve research also reports the house price to rent ratio peaked in late 2006 and then fell by more than 10% within two years and more than 20% within four years, while a Federal Reserve Bank of Philadelphia analysis spanning 1890 to 2006 found rent to price falling from roughly 8% in the early twentieth century to about 3% by 2006, equivalent to moving from about 12.5 years of gross rent to roughly 33.3 years.
That long swing carries a practical lesson. A ratio that looks extreme against one era's norm may look ordinary against another's, so compare your result with local and historical averages for the same market instead of a single national rule. Ask what typical ratios look like nearby today, and how they've behaved across a full housing cycle.
Why Ownership Costs Shift the Reasonable Range
Economic research links the ratio to the reciprocal of the user cost of owning, meaning higher interest rates, taxes, insurance, depreciation, or required returns raise the true cost of ownership and can change what ratio is reasonable even when rents don't move, as explained in the St. Louis Fed material linked earlier. Expected rent growth, credit conditions, maintenance, and housing risk push in the same way. Two markets can therefore share a ratio while offering very different ownership economics.
Compare your result with nearby homes and local history first. Generic thresholds come last, if you use them at all.
Also keep your purpose straight. An owner occupier is weighing shelter, stability, and monthly affordability, while an investor is weighing income after expenses against capital tied up in the property. The gross ratio speaks to both, but it fully answers neither, so treat it as a screening signal that tells you where deeper analysis is worthwhile.
Use the Ratio in Buy Versus Rent Decisions
Once you have a ratio you trust, put it to work as one step in a sequence rather than the whole decision. The OECD describes this measure as a nominal house price index divided by a rent price index and relates it to the profitability of ownership, not a complete affordability or investment return calculation, in its housing price indicators and price to rent methodology. That framing points to the follow up question the ratio can't answer: what will ownership cost you each month and over your whole stay after financing?
Questions to Answer After the Calculation
- How does this home compare locally? Check similar homes nearby so you know whether the result is typical or an outlier.
- What's the full monthly ownership cost? Add mortgage payment, taxes, insurance, fees, and a maintenance allowance.
- How much cash does buying require upfront? Count the down payment, closing costs, and reserves you'll still need afterward.
- How long will you realistically stay? A short stay leaves little time to recover transaction costs.
- What does renting preserve? Flexibility to move, cash that stays liquid, and freedom from repair bills have real value.
Your income picture matters here too, and working through how much rent you can afford based on income helps you judge whether the rental alternative itself is comfortably within budget before you compare it with a purchase. If you want a broader side by side framework after the ratio screen, learning to compare renting and buying with full ownership costs and a break even horizon is a logical next step.
Run Scenarios, Not a Single Case
Mortgage interest, down payment opportunity cost, closing and selling costs, income taxes, depreciation, rent growth, home price growth, and the time value of money can all change the outcome, and these items sit outside the basic ratio methodology in the OECD framework linked above. So test a few combinations: a higher mortgage rate, slower appreciation, faster rent growth, and a shorter holding period. If buying only wins under the friendliest combination, that's important information.
Renting longer isn't a failure state in this process. If the ratio is high, your stay is uncertain, and ownership costs strain your budget, renting while you build savings can be the disciplined choice. If the ratio is low, financing is manageable, and you expect to stay put, buying deserves serious consideration. Household stability, job location, and your comfort with maintenance responsibility belong in the same conversation, because a decision that looks fine on a spreadsheet still has to work in your actual life.
Make a More Complete Housing Decision
Before you act on any result, run a short review that you can repeat for every home you consider. This keeps your comparisons honest and makes it easier to explain your reasoning to a partner, family member, or adviser.
Your Repeatable Checklist
- Document the inputs: Record geography, property type, dates, and which rent definition you used.
- Check the context: Compare the gross ratio with local alternatives and historical norms, not generic cutoffs like 15 or 20 mentioned as common thresholds in the OECD related discussion above.
- Inspect the expenses: Review vacancy, taxes, insurance, fees, maintenance, and repair assumptions one by one.
- Stress test the result: Change mortgage rate, rent growth, appreciation, and holding period to see when the answer flips.
- Confirm affordability: Make sure the full monthly cost and upfront cash fit your budget with room to spare.
Cross border comparisons need extra care. The Lumen calculator discussion linked earlier notes that taxes, tenancy rules, financing systems, and rent controls differ across countries, and that index based housing data carry limitations, so a ratio from one country shouldn't be judged by another country's norms. Within your own market, ask whether today's asking rent, a historical rent, or a conservative stabilized rent is the fairest denominator, especially when vacancies or rents are shifting quickly.
If you're also setting up shared housing while you decide, planning a first apartment budget can help you organize deposits, utilities, and monthly costs so renting in the meantime stays financially tidy. The central lesson stays the same either way: a price to rent ratio calculator supports your judgment with a clean first screen, while the final decision also needs affordability, risk, time horizon, and your own priorities.
When you do land on a place, whether you're renting a while longer or settling in with housemates, Divvy can take the friction out of shared costs by scanning receipts with AI, dividing items, tax, and tip fairly, and sending payment requests through apps your group already uses. It's a practical way to keep household and group expenses transparent while you focus on the bigger housing decision. Visit Divvy to see how item level splitting can simplify the money side of shared living.